UCF Knights Defense Continues as #1 in Red Zone Defense
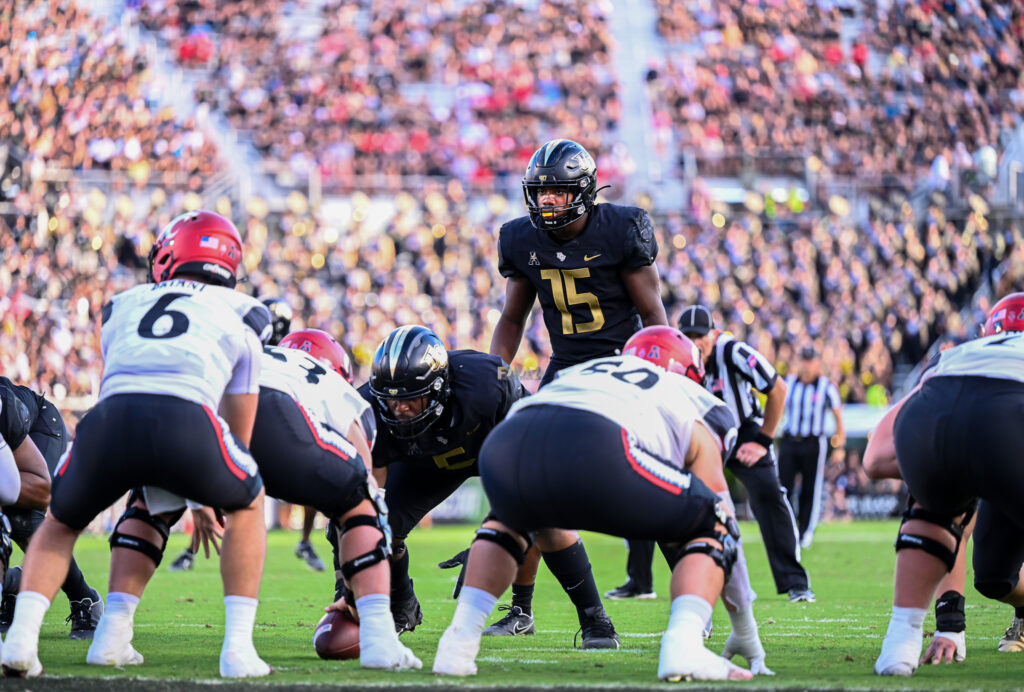
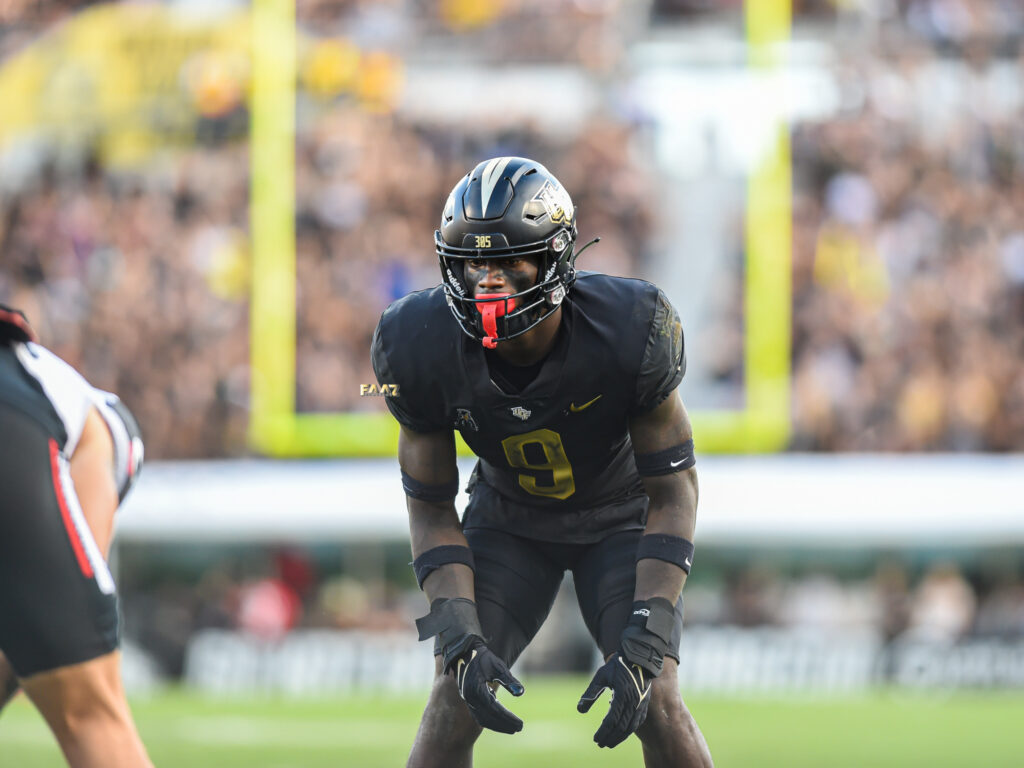
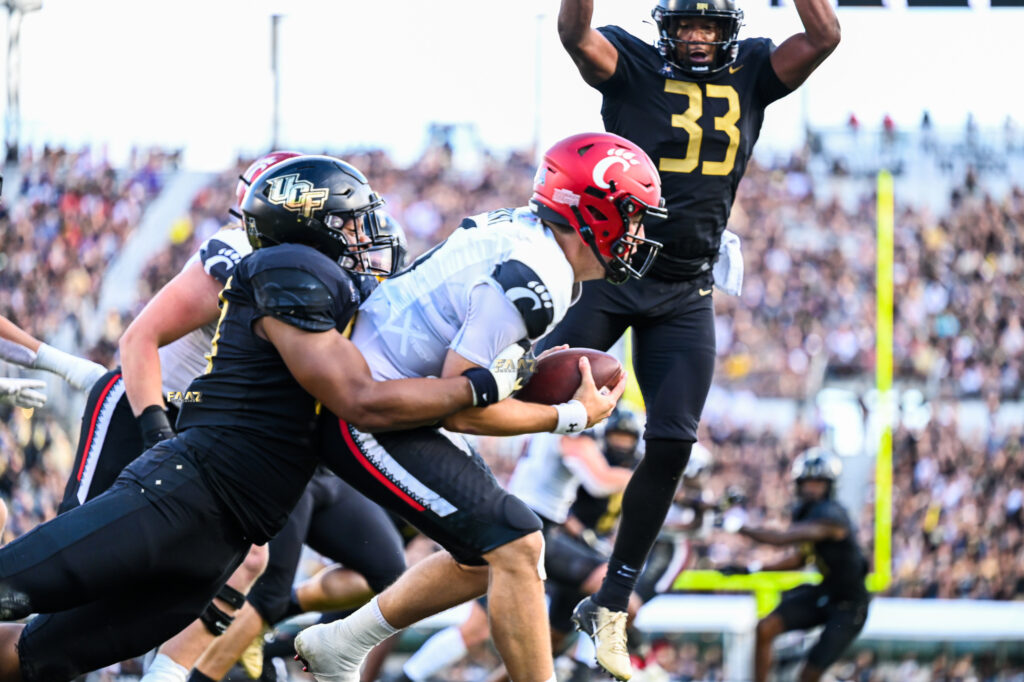
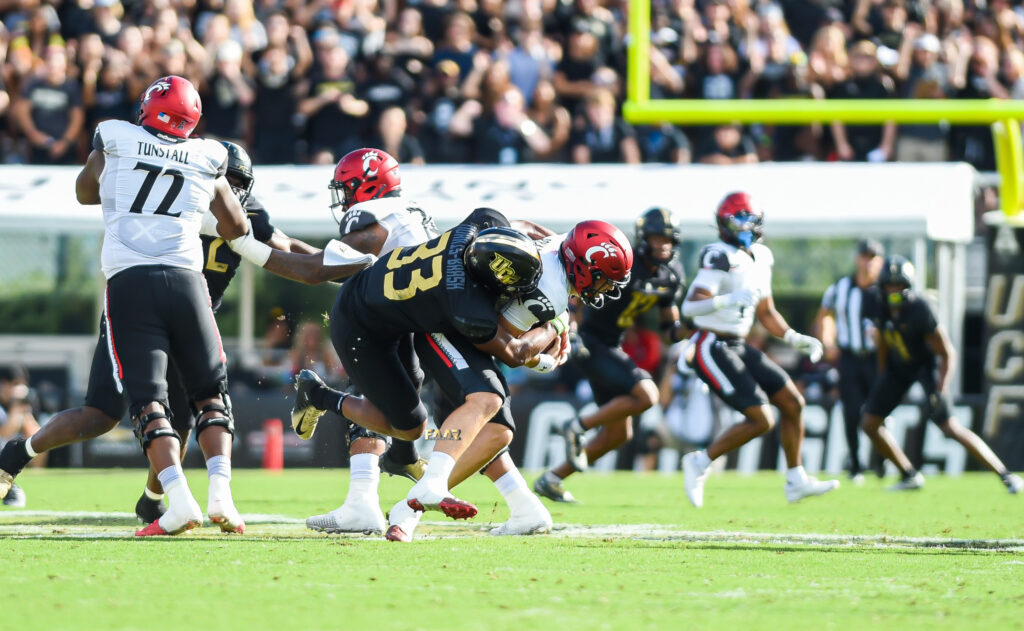
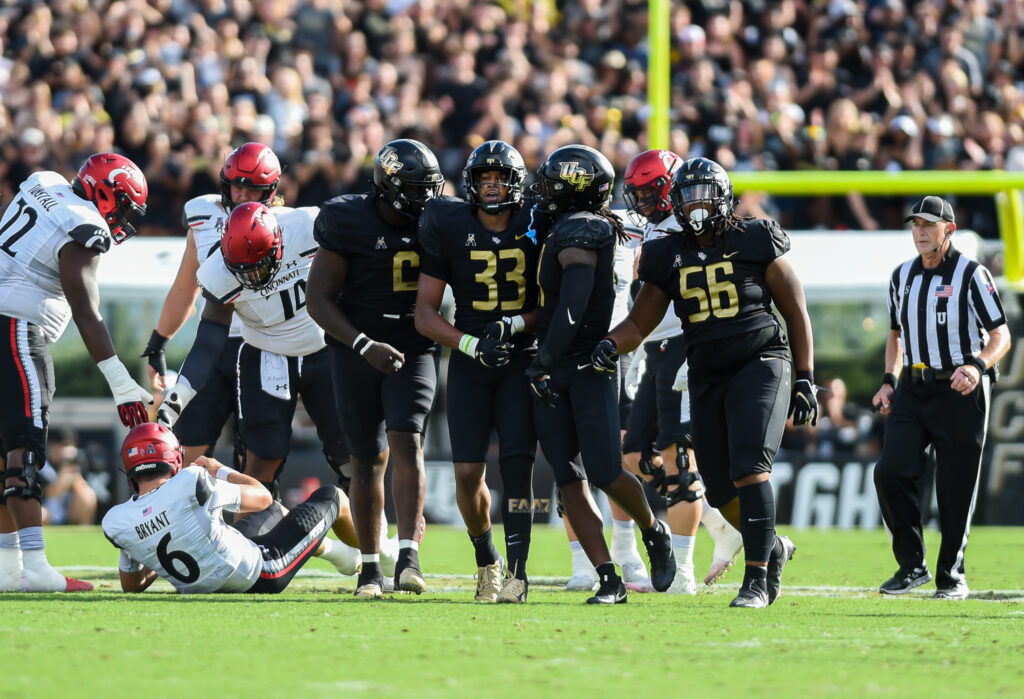
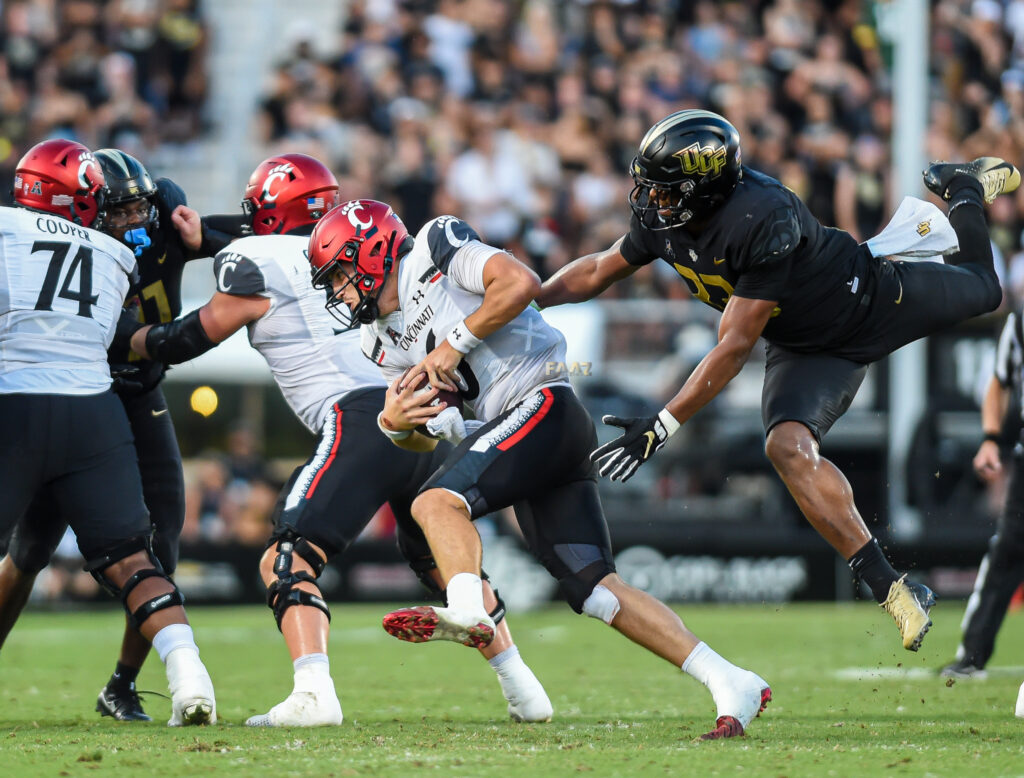
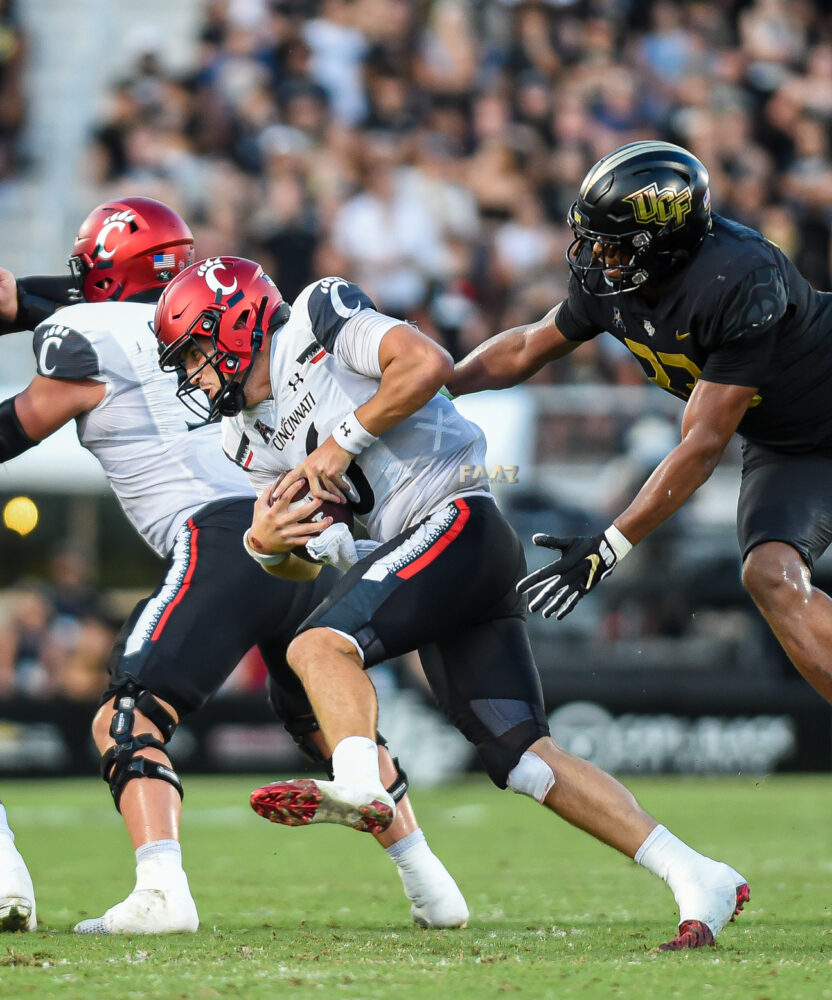
UCF Knights defense continue to prove that they are one of the top defenses in the nation. After a step back against loss to ECU, the Knight’s defense rebounded strong with a win over #20 Cincinnati. Against the Bearcats, UCF allowed only 35 yards rushing & 18 first downs. In the 3 red-zone chances, Cincinnati was only to get into the end zone once & settled for field goals the remaining two times.
Now eight games into the season, the 6-2 Knights continue to hold the top spot in Red Zone Defense, currently rank in the Top 25 in 6 other categories, and in the Top 50 in 9 more.
Here are the categories that the Knights defense rank in the Top 50 nationally and how they compare to their in-state rivals.
1st in Red Zone Defense – In 29 attempts, UCF has only allowed 18 scores 62.1% 5 rushing TD’s, 3 passing TD; 10 FG’s.; UGA 2nd 64.3%, USF 33rd, UM 34th, Alabama 38th
6th tied(5th previously) in Block Kicks – 3 blocked kicks. FSU & FIU#23(tied)
9th tied(6th previoulsy) in Blocked Punts – In 39 punt attempts, UCF has 2 blocks & both have been returned for TD’s.
12th tied(14th previously) in 4th Down Conversion Percentage Defense – 6/19 31.6%. Alabama 19th, UF 40th, FIU 48th
16th tied(8th previously) in Scoring Defense – UCF has allowed 15 TD’s 12 field goals totaling 141 points for an average of 17.62 points/game. UGA 2nd 10.50 avg,, FSU 37th, UM 44th
20th KickOff Return Defense – 9 KO Returns, 39 KO Touchbacks, 154 Return Yds, 17.11 avg; Michigan 10th, FAU 18th, USF 50th
21st(9th previously) in Team Passing Efficiency Defense – 167/293 1,885 yds 6 TD 2 INT 116.43 passing efficiency; UGA 3rd 103.01
27th(25th previously) in Time of Possession – 255 min total & 31 avg. UM 26th, FSU 48th
35th
28th(41st previously) in Rushing Defense – 248/927 yds, 3.74 yds/rush, 9 TD 115.9 yds/game. UGA 5th 85.5 yards/game, UM 24th
29th tied(13th previously) in 3rd Down Conversion Percentage Defense- 39/117 33.3%. Alabama #2 at 26.4%, FSU 39th, UM 44th, & FAU 49th
31st(previously unranked) in Fewest Penalties – 43 penalties for 415 yards; UGA 4th, USF 12th, UF 38th
32nd(tied & previously unranked) in Fewest Penalties Per Game – 43 penalties 5.38 penalties/game; UGA 5th 4.0/game, USF 13th, UF 39th
40th(26th previously) in Total Defense- 541 plays for 2,812 yards, 5.20 yds/play, 351.5 yds/game.; UGA 4th 262.6 yds/game, FSU 21st; Miami 34th
44th tied(30th previously) in 1st Downs Defense – 47 Rush, 89 Pass, 19 Penalty, Total 155. UGA 4th 105 first downs, Miami 13th, FSU 50th, Alabama unranked
44th tied(35th previously) in Team Tackles For Loss – 39 for 183 total yards for 6.2 yds/game. Cincinnati 1st 9.0 yds/game, Miami 14th, FSU 32nd
49th(tied & previously unranked) in Fewest Penalty Yards – 43 for 415 yards; USF 9th, UF 15th
Photo credit: Sean Russell/FAAZ Sports
