UCF Defense Top 25 in 5 Categories After Week 1
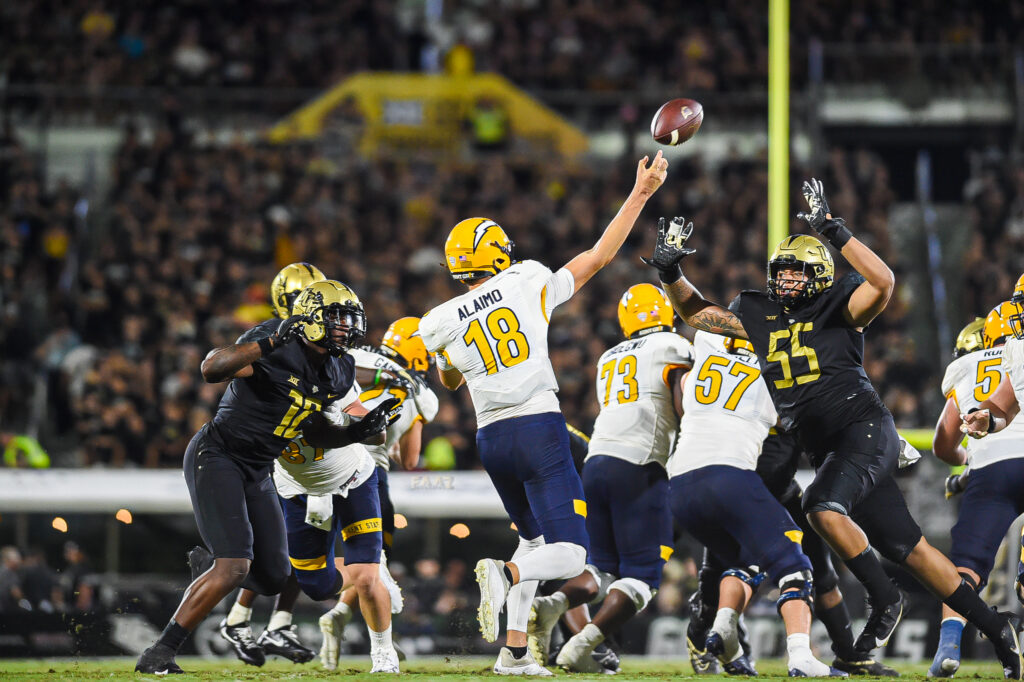
The UCF Knights opened their 2023 season in Week 1 versus Kent State on Saturday, September 2 at FBC Mortgage Stadium in Orlando, FL. In their dominate 56-6 win, the Knights held the Golden Flashes to 239 total yards of total offense(94 rushing 145 passing). They open the season ranked in the Top 25 in 5 different offensive categories and Top 50 in another 8.
Here are the categories that the Knights defense rank in the Top 50 nationally and how they compare to their in-state rivals.
1st(tied) in 4th Down Conversion Percentage Defense – 0/1 0.0%.
9th in Team Passing Efficiency Defense – 12/32 145 yds 0 TD 1 INT 69.3 passing efficiency. Southern Miss 1st 33.5, Ohio State 12th 75.6, UGA 27th 91.0, Alabama 23rd 104.21
10th(tied) Punt Return Defense – 1 punt 0 return yards. FSU 1st -3.0 yards, Miami -2.0 yards,over 40 teams tied with 0 return yards
12th(tied) in Scoring Defense – UCF has allowed 0 TD 2 field goals totaling 6 points. 5 teams(BYU, Ga Southern, Kansas St, Oklahoma, & Syracuse) shut out their week 1`opponents. 6 others held their opponents to less than 6 points
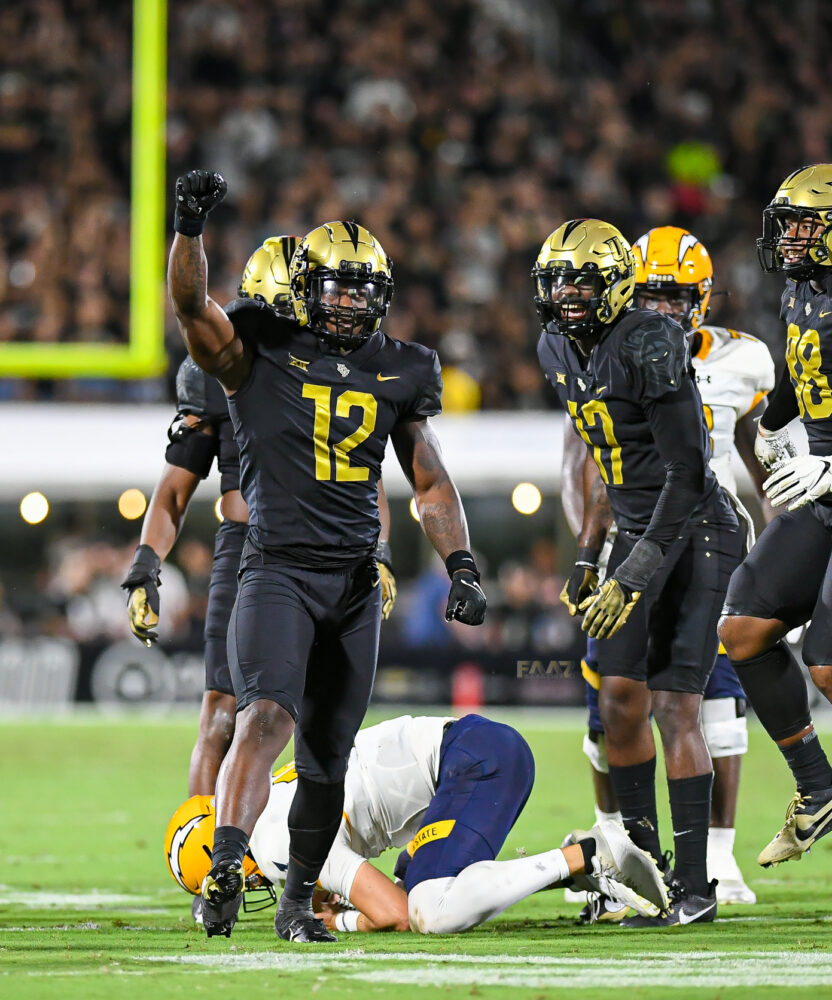
14th(tied) Team Sacks – 4 sacks 16 yds 4 yd avg. North Carolina 1st 9 sacks 9yd avg, FSU 14th, Alabama 27th 3 yd avg
30th in Total Defense- 68 plays for 239 yards, 0TDs 53.51 yds/play, 239 yds/game. Memphis 1st 75.0 yds/game, Alabama 18th 208. yds/game, Miami 20th 215 yds/game, Georgia 36th 260 yds/game Florida 41st 270 yds/game
33rd in Team Tackles For Loss(TTFL) – 5 solo 4 Assist 25 tackle yards 7.0 TTFL. North Carolina 1st 16TTFL, Tenn 11 TTFL, Alabama 33rd
33rd in Passing Yards Allowed- 12/32, 145 yards 4.53 yds/attempt 12.08 yds/completion 145 yds/game. Ga. Southern 1st 14.0 yds/game, Ohio State 9th 82 yds, Georgia 22nd 128 yds, Alabama 26th 133 yds, Miami 48th 164 yds, Florida 49th 165 yds
35th(tied) in 1st Downs Defense – 5 rush 8 pass 2 penalties 15 opponent 1st downs. Memphis 1st 4 1st downs, Miami 9th 10 1st downs, Alabama & Florida 26th 13 1st downs
36th(tied) Passes Intercepted – 1 INT
43rd(tied) in Rushing Defense – 53/94 yds, 2.61 yds/rush, 94 yds/game. Stanford 1st -.05yds/game, Texas 7th 27.0/yds/game, Miami 16th 51.0 yds/game, Alabama 32nd 78.0 yds/game
49th(tied) Net Punting – 1 punt 0 return yds 42.0 yds. Oregon 1st 58 net yds
50th in Time of Possession – 31 min total. Pitt 1st 41, FSU 12th 35, Miami 33rd 32
UNRANKED CATEGORIES
Red Zone Defense – 1 attempt 1 FG 100%. Top 50 is 66.7%
3rd Down Conversion Percentage Defense – 7 conversions 17 attempts 41.1% – Memphis #1 at 6.7%, UGA 10th 14.3%, Miami 13th 16.7%, Florida 26th 23.1%, FSU 45th 30.0%
Block Kicks – 0 blocks
Blocked Punts – 0 blocks
Defensive TDs – 0 TDs
Fewest Penalties – 7 penalties for yards. Top 50 is 46 yds
Fewest Penalties Per Game – 7 penalties 70 penalties. Top 50 is 5 penalties
Fewest Penalty Yards -7 penalties 70 yds. Top 50 is 42 yds
Fewest Penalty Yards per Game – 7 penalties 70 yds. Top 50 is 41 yds
Fumbles Recovered – 0 fumbles recovered
KickOff Return Defense – 3 KO Returns 3 KO Touchbacks 80 Return Yds 26.7 avg. FAU 50th 15.5 avg
Photo credit: (cover)Sean Russell; (gallery) Cameron Robertson, Brianna Russell, Sean Russell/FAAZ Sports


