UCF Defense Move Up in Rankings Thru Week 3
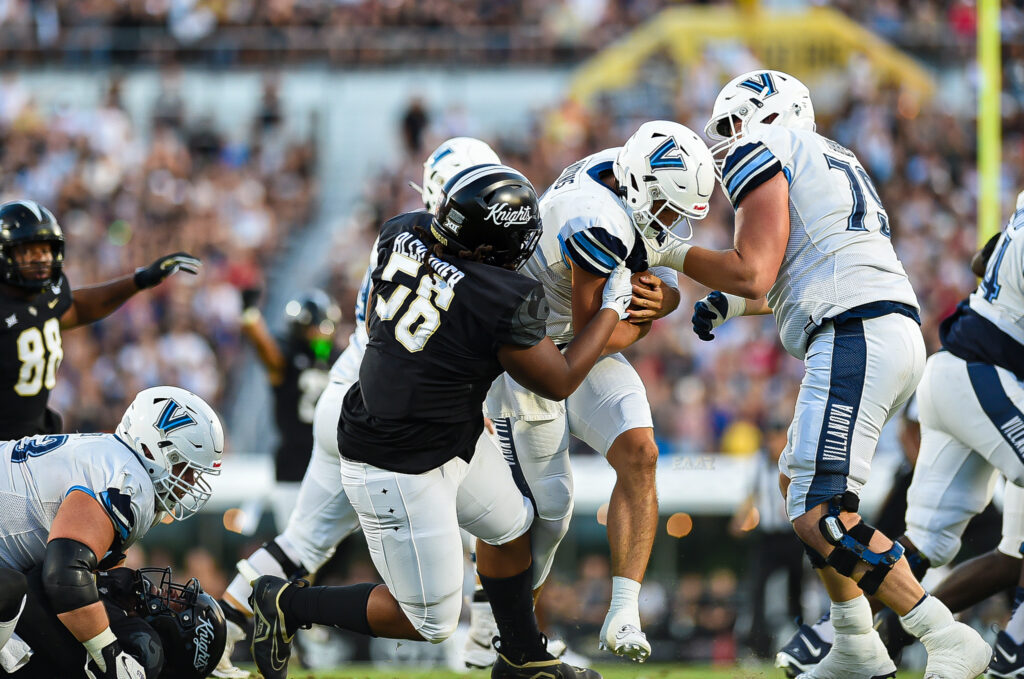
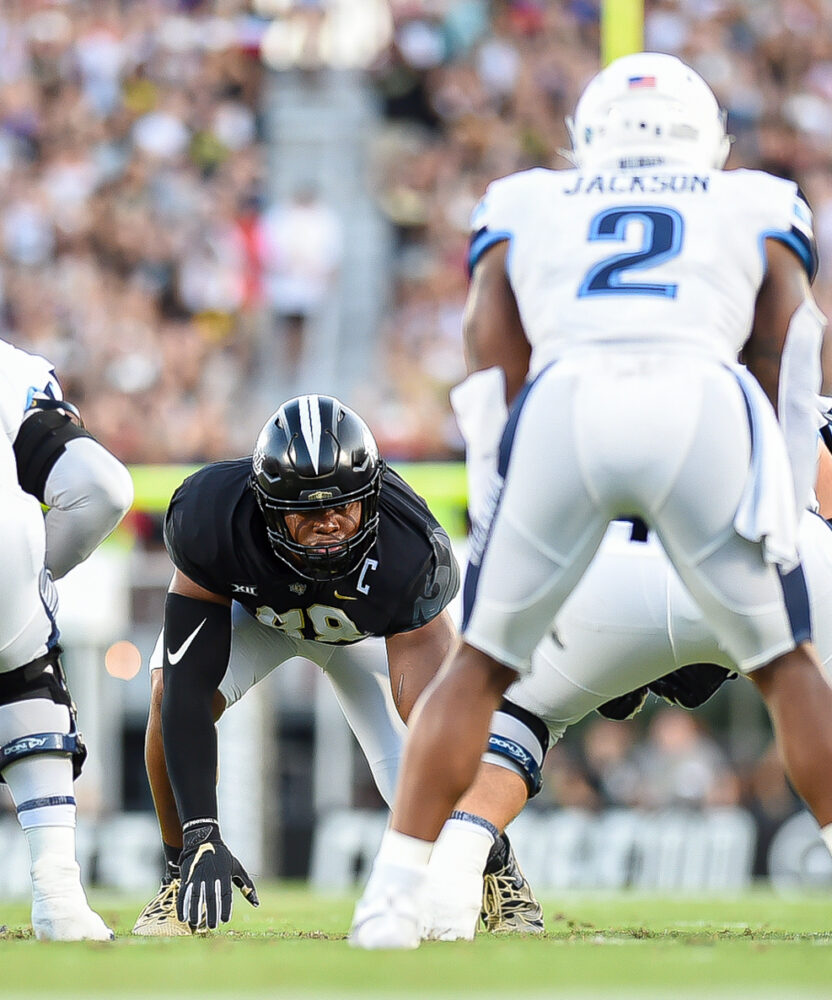
The UCF defense improved in numerous categoric rankings after their dominate Week 3 win over Villanova at home in FBC Mortgage Stadium in Orlando, FL. The Knights held the Wildcats to 228 yards of total offense(83 rushing & 145 passing) and 14 points. The Knights are now ranked in the Top 25 in 4 different offensive categories and Top 50 in another 5.
Here are the categories that the Knights defense rank in the Top 50 nationally and how they compare to their in-state rivals.
10th(prev. 21st) in Team Passing Efficiency Defense – 35/82 500 yds 3 TD 2 INT 94.63 passing efficiency. Notre Dame 1st 84.73, Georgia 4th 86.79, Ohio State 8th 93.80, FSU 40th 115.45, USF 41st 116.83, Miami 43rd 117.75, FAU 48th 120.68.
16th-tied(prev. 17th) in Scoring Defense – UCF has allowed 4 TD 3 extra pt 3 field goals totaling 36 points 12.00avg. Michigan 1st 5.33 avg, Georgia 3rd 8.00 avg, Miami 24th(tied) 13.00 avg, Texas 26th(tied) 14.67 avg, Florida 31st(tied) 15.67
20th(prev. 33rd in Passing Yards Allowed- 35/82, 500 yards, 6.10 yds/attempt, 14.29 yds/completion 166.7 yds/game. Memphis1st 112.7 yds/game, Florida 24th 172.7 yds/game, Georgia 28th 177.0 yds/game, Alabama 37th 189.7 yds/game
25th(prev. 35th) in First Downs Defense – 17 rush 18 pass 2 penalties 37 opponent 1st downs. Marshall 1st 32FD, Florida 10th 36FD, Miami 14th(tied) 43FD, Georgia 19th(tied) 45FD, 38th 50FD
27th(prev. 47th) in Total Defense- 187 plays for 851 yards, 4TDs 4.55 yds/play, 283.7 yds/game. Air Force 1st 179.3 yds/game, Florida 10th 256.3 yds/game, Georgia 15th 264.3 yds/game, Miami 18th 271 yds/game, Texas 22nd 276.3 yds/game, Alabama 45th 307.7. yds/game
34th(prev. unranked) 3rd Down Conversion Percentage Defense – 14 conversions 43 attempts 32.6% – Top 50 is 35.3%
35th-tied(prev. 26th) in Team Tackles For Loss(TTFL) – 17 solo 6 Assist 75 tackle yards 6.7 TTFL. Texas St. 1st 11.3TTFL, USF 13th(tied) 8.3 TTFL, FIU & Miami24th(tied) 7.0, Alabama 49th(tied) 6.3TTFL
38th-tied(prev. 28th) Team Sacks – 8.0 sacks 48 yds 2.67 yd avg. Wake Forest 1st 16.0 sacks 5.33yd avg, Texas(tied) 3.50 avg, FSU 38th(tied) 2.67yd avg
44th-tied(prev. 42nd) Passes Intercepted – 3 INT 43 return yds 0 INT return TD. Liberty 1st 9 INT, Georgia 3rd(tied) 6 INT, Texas 11th(tied) 5th,

UNRANKED CATEGORIES
(prev. 29th) Net Punting – Top 50 is 40.22
(prev. 1st)4th Down Conversion Percentage Defense(prior 1st) – Top 50 is 42.9.%
(prev. 10th) Punt Return Defense – Top 50 is 3.75yd avg
(prev. 43rd) in Rushing Defense – Top 50 is 114.7 yds/game
(prev. 50th) in Time of Possession – Top 50 is 31 avg
Red Zone Defense – Top 50 is 77.8%
Block Kicks – 0 blocks
Blocked Punts – 0 blocks
Defensive TDs – 0 TDs
Fewest Penalties – Top 50 is 16 penalties
Fewest Penalties Per Game – Top 50 is 5.33 penalties
Fewest Penalty Yards – Top 50 is 141 yds
Fewest Penalty Yards per Game – Top 50 is 46.67 yds
Fumbles Recovered – 0 fumbles recovered
KickOff Return Defense – Top 50 is 17.50 avg
Photo credit: Sean Russell/FAAZ Sports


