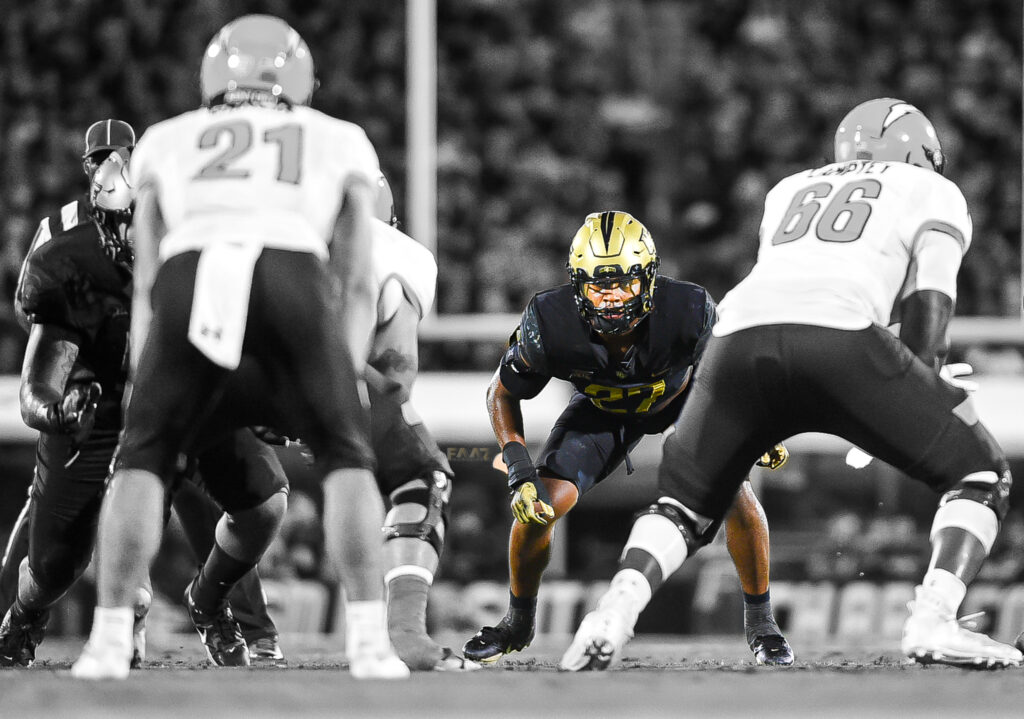
UCF Defense Remains in Top 20 Scoring Defense
The UCF Knights battled thru miscues in Week 2 versus Boise State on Saturday, September 9 at Albertsons Stadium in Boise, ID. In their game ending 18-16 win off of the foot of kicker Colton Boomer, the Knights held the Broncos on The Blue field to 384 total yards of total offense(173 rushing 211 passing). Through Week 2, the Knights are ranked in the Top 25 in 2 different offensive categories and Top 50 in another 6.
Here are the categories that the Knights defense rank in the Top 50 nationally and how they compare to their in-state rivals.
17th-tied(prev. 12th) in Scoring Defense – UCF has allowed 2 TD 1 extra pt 3 field goals totaling 22 points 11.00avg. Syracuse 1st 3.50 avg, Georgia 2nd(tied) 5.00 avg, Tenn 23rd(tied) 13.00 avg, Florida 37th(tied) 15.50 avg, Texas 43rd 17.00 avg
21st(prev. 9th) in Team Passing Efficiency Defense – 26/59 356 yds 2 TD 2 INT 99.16 passing efficiency. Memphis 1st 74.18, Georgia 3rd 77.71, Ohio State 13th 89.85, FSU 28th 104.65, FAU 41st 112.98, Miami 46th 115.06
26th-tied(prev. 33rd) in Team Tackles For Loss(TTFL) – 12 solo 6 Assist 53 tackle yards 7.5 TTFL. Tenn 1st 12.5TTFL, USF 14th(tied) 8.5 TTFL, Texas 36th9tied) 7.0TTFL
28th-tied(prev. 14th) Team Sacks – 6.0 sacks 31 yds 3.00 yd avg. Nebraska 1st 9 sacks 5.50yd avg, Texas(tied) 3.50 avg, FSU 28th(tied)
29th-tied(prev. 49th) Net Punting – 3 punt 7 return yds 42.67 net yds. Alabama 1st 50.25 net yds, USF 13th 45.27 net yds, Florida 18th, 44.4 net yds, FSU 23rd 43.5 net yds
33rd in Passing Yards Allowed- 12/32, 145 yards, 4.53 yds/attempt, 12.08 yds/completion 145 yds/game. Air Force 1st 78.5 yds/game, Florida 8th 115.5 yds/game, Georgia 14th 137.5 yds/game, Tenn 46th 183.0 yds/game
42nd-tied(prev. 36th) Passes Intercepted – 2 INT 1 return yds
47th(prev. 30th) in Total Defense- 68 plays for 239 yards, 0TDs 53.51 yds/play, 239 yds/game. Air Force 1st 118.0 yds/game, Florida 3rd 191.0 yds/game, Georgia 242.0 yds/game, Texas 28th 269.0 yds/game, Alabama 18th 208. yds/game, Miami 20th 215 yds/game, Georgia 36th 260 yds/game Florida 41st 270 yds/game
UNRANKED CATEGORIES
(prev. 1st)4th Down Conversion Percentage Defense(prior 1st) – 1/2 50.0%. – Top 50 is 40.%
(prev. 10th) Punt Return Defense – 2 punt 7 return yards 3.5 yd avg. Texas 1st -6.00 yd avg, FSU 2nd -3.0 yards, USF 6th(tied) -1.0 yd avg, Duke 49th(tied) 1.50 yd avg
(prev. 35th) in First Downs Defense – 17 rush 18 pass 2 penalties 37 opponent 1st downs. Air Force 1st 15FD, Florida 2nd 19FD, Georgia 15th(tied) 28FD, Top 50 is 34FD
(prev. 43rd) in Rushing Defense – 92/267 yds, 2.90 yds/rush, 133.5 yds/game. Kansas St 1st 38.0 yds/game, Miami & USF 19th(tied) 74.0 yds/game, Florida 22nd 75.5 yds/game, Georgia 49th 104.5 yds/game
(prev. 50th) in Time of Possession – 31 min total. Top 50 is 31 avg
Red Zone Defense – 1 attempt 1 FG 100%. Top 50 is 77.8%
3rd Down Conversion Percentage Defense – 13 conversions 31 attempts 41.9% – Top 50 is 33.3%
Block Kicks – 0 blocks
Blocked Punts – 0 blocks
Defensive TDs – 0 TDs
Fewest Penalties – Top 50 is 46 yds
Fewest Penalties Per Game – Top 50 is 5 penalties
Fewest Penalty Yards – Top 50 is 42 yds
Fewest Penalty Yards per Game – Top 50 is 41 yds
Fumbles Recovered – 0 fumbles recovered
KickOff Return Defense – Top 50 is 17.00 avg
Photo credit: Sean Russell/FAAZ Sports


