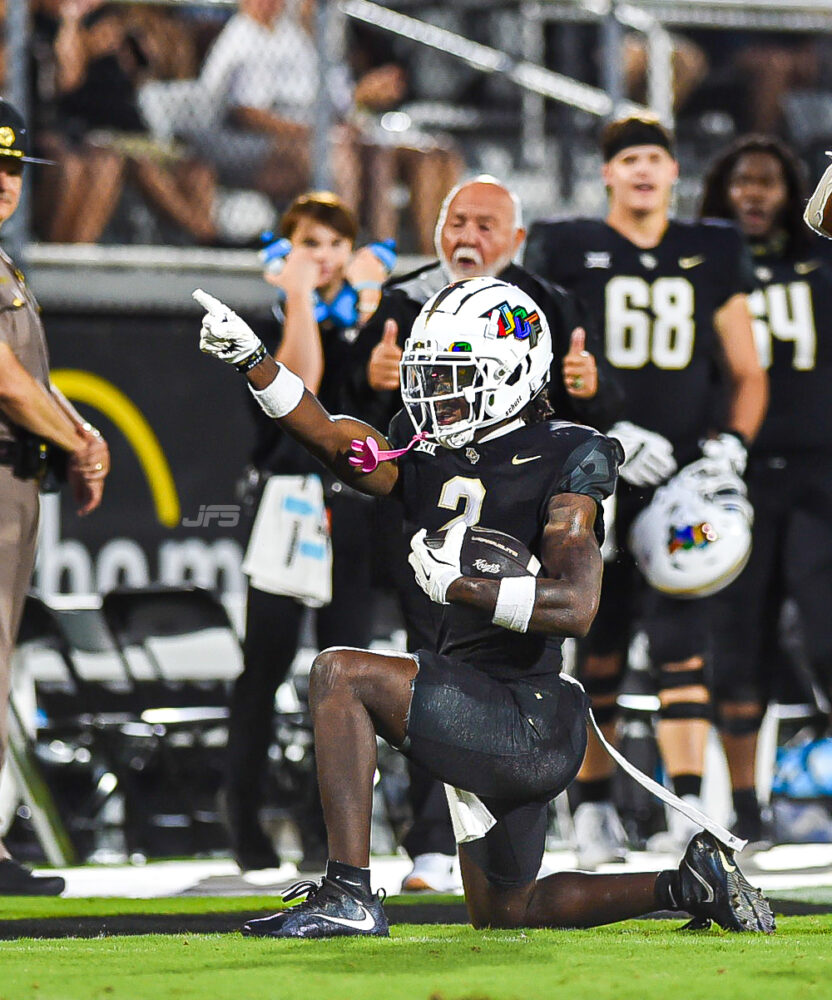
UCF Offense One of Best in Nation
Early into the 2024 season and now heading into Week 4, the UCF Knights offense has once again made a home as one of the best in the nation. The Knights are ranked #2 in Rushing Offense and #6 in Total Offense
Through Week 3, UCF currently ranks in the Top 25 in 6 other categories, and Top 50 in 8 more.
In the Big 12 Conference, UCF’s offense ranks #1. Individually, running back RJ Harvey ranks #3 with 448 yards and wide receiver Kobe Hudson ranks #10 with 310 yards.
Although the Knights are not yet ranked in the AP Top 25, they have received recognition at #18 in the ESPN FPI TOP 25
The most important stat of all is that they are currently defeated with a 3-0 record.
UCF will have a bye week in Week 4 and host Colorado on Saturday, September 28 at FBC Mortgage Stadium. Kick off is TBD.
Here are the categories that the Knights offense rank in the Top 50 nationally and how they compare to notable ranked teams and other in-state programs:
2nd in Rushing Offense – 165/1127 yards 6.83 yds/rush, 13 TDs 375.7 yds/game. Army 1st 8 TDs 390.0 ypg, Tennessee 3rd 14 TDs 336.3 ypg, USF 8th 11 TDs 268.7 ypg, Miami 33rd 8 TDs 204.0 ypg, Michigan 50th 3 TDs 176.3 ypg
6th in Total Offense – 226 plays 1,712 yds 7.58 yds/play 18 TDs 570.7 YPG. Ole Miss 1st 692.0 YPG, Tennessee 2nd 639.3 YPG, Miami 3rd 609.3, Texas 10th 516.0 YPG, Alabama 26th 466.7 YPG, Oklahoma State 446.3 YPG, Arizona 40th 437.3 YPG, USF 46th 424.7 YPG
8th in 3rd Down Conversion Percentage 23/40 attempts 57.5%. Arkansas 1st 67.5%, Miami 3rd 60.6%, Tennessee 56.8%, Alabama 16th 52.5%, Colorado 47th(tied) 44.4%
8th in 1st Down Offense – 86 1st Downs(62 run, 22 pass, 2 penalty). Ole Mis 1st 104 1st downs, Tennessee 5th 90 1st downs, Miami 7th 87 1st downs, USF 32nd(tied) 68 1st downs
12th in Scoring Offense – 18 TDs 16 PATs 1 2PT 3 pg 1 Safety 137.0 points 45.7 ppg. Tennessee 1st 63.7 ppg, Ole Miss 2nd 56.0 ppg, Miami 5th 53.0 ppg, Alabama 7th 49.0 ppg, Texas 10th 46.3 ppg, USF 25th(tied) 37.7 ppg, Oklahoma 49th(tied) 33.7 ppg
14th in Passing Yards Per Completion – 38/61 585 yards 15.39 yards/completion. Navy 1st 19.00 yds/completion, Florida 16.41 yds/completion, Alabama 13th 15.59 yds/completion, Miami 20th 14.83 yds/completion, Texas 32nd 13.89 yds/completion,
24th(tied) in Passes Intercepted – 61 attempts 1 INT. 23 teams have had 0 interceptions
25th in Team Passing Efficiency – 41/61 585 yds 11 TDs 1 INT 166.62 Passing Efficiency. Penn State 1st 25/38 439 yds 209.67 PE, Miami 3rd 82/109 1216 yds 203.43 PE, 6th Ole Miss 199.23 PE, Alabama 8th 193.98 PE, Tennessee 15th 175.82 PE, TCU 30th 161.48 PE, Colorado 36th 158.22 PE, Florida 44th 153.99 PE
29th(tied) in Sacks Allowed – 3 sacks 18 yards 1.00 avg/game – Oklahoma State 1st(tied) 0.0 sacks allowed, TCU 9th(tied) 1 sack allowed, Miami 29th(tied) 1.00 avg/game
31st Kickoff Returns – 5 returns 117 yards 0 TDs 23.4 yard avg. Alabama 1st 52.0 yard avg, Colorado 7th 33.0 yard avg, Florida 12th 29.60 yard avg, Miami 41st(tied) 22.0 yard avg, Kansas St 49th(tied) 21.0 yard avg
32nd(tied) Tackles For Loss Allowed – 11/36 yds TTFL 3.67 avg. Army 1st 1.0 avg, Ohio State 8th(tied) 2.5 avg, Miami 12th(tied) 2.67 avg, Tennessee & Georgia 32nd(tie), Alabama 48th(tie) 4.33 avg
32nd in Fewest Penalties Per Game – 14 penalties 4.70 penalties/game. Miami(OH) 1st 12.5/game, FSU 19th 34.33/game, Texas 36th 43.0/game
35th(tied) in Fewest Penalties – 14 penalties for 125 yards. Miami(OH) 1st 5/25yds, Ohio State 29th(tied) 13/103yds, FSU 35th(tied) 14/103yds
38th in Fewest Penalty Yards – 14 penalties 125yds. Miami(OH) 5/25yds, FSU 27th(tied) 14/103yds, Texas 42nd(tied) 17/129yds, USF 31st(tied) 3 INT
43rd(tied) in Punt Returns – 9 returns 99 yards 11.00 yd avg. Troy 1st 43.0 yd avg, Tennessee 14th 21.18 yd avg, USF 30th(tied) 14.0 yd avg, Florida 35th 13.00 yd avg, Georgia 0.62 yd avg, Alabama 50th 10.00 yd avg


